Containerlab GUI#
Containerlab GUI is the graphical way to create, edit, deploy, and operate Containerlab labs. The same topology UI is used by the VS Code extension, the Desktop app, and the Web app; what changes is the host that performs the privileged work.
| GUI | Use it when | Runtime access |
|---|---|---|
| VS Code Extension | You work with topology files in VS Code, locally or through Remote SSH. | VS Code runs Containerlab commands on the VS Code host. |
| Desktop | You want a standalone application window on Linux, macOS, or Windows. | The app connects to a reachable clab-api-server. |
| Web | You want a browser UI for a shared lab host, VM, or server. | The web app connects to a reachable clab-api-server. |
| Browser sandbox | You want to try the editor without installing anything. | Browser storage only; no real lab deployment. |
Support
If you have any questions about this extension, please join us in the Containerlab Discord.
How it works#
The GUI is built around a shared topology editor called TopoViewer.
In VS Code, TopoViewer runs in a VS Code webview. The extension reads and writes files through VS Code APIs and runs Containerlab commands in the same environment as the VS Code window. If you use Remote SSH, that environment is the remote Linux host.
In the Desktop and Web apps, TopoViewer runs in the standalone app. The standalone app talks to clab-api-server, and the API server performs lab lifecycle, file, terminal, capture, image, and inspection operations on the Linux host where Containerlab and the container runtime live.
This split is important:
- the topology editor is shared across all GUIs
- VS Code does not need
clab-api-server - Desktop and Web do need
clab-api-server - Containerlab labs remain normal
*.clab.ymlfiles that can still be reviewed, version controlled, and used from the CLI
The GUI may also create an annotations file next to the topology file. The topology YAML keeps the lab definition. The annotations file stores visual data such as node positions, free text, shapes, groups, and display preferences.
Custom node templates are host state, not topology state. They are reusable presets used by the editor to create normal Containerlab nodes. The storage location depends on the host: VS Code stores them in VS Code settings, Desktop and Web load them from the selected API server endpoint and Linux user, and the browser sandbox stores them in browser storage.
Shared workflow#
The GUI follows the same lifecycle as the CLI:
- Create or open a topology file.
- Edit nodes, links, labels, groups, and topology metadata.
- Deploy the lab.
- Inspect and operate running nodes.
- Destroy, redeploy, or save the lab when needed.
Most workflows start in the Explorer or directly in TopoViewer.
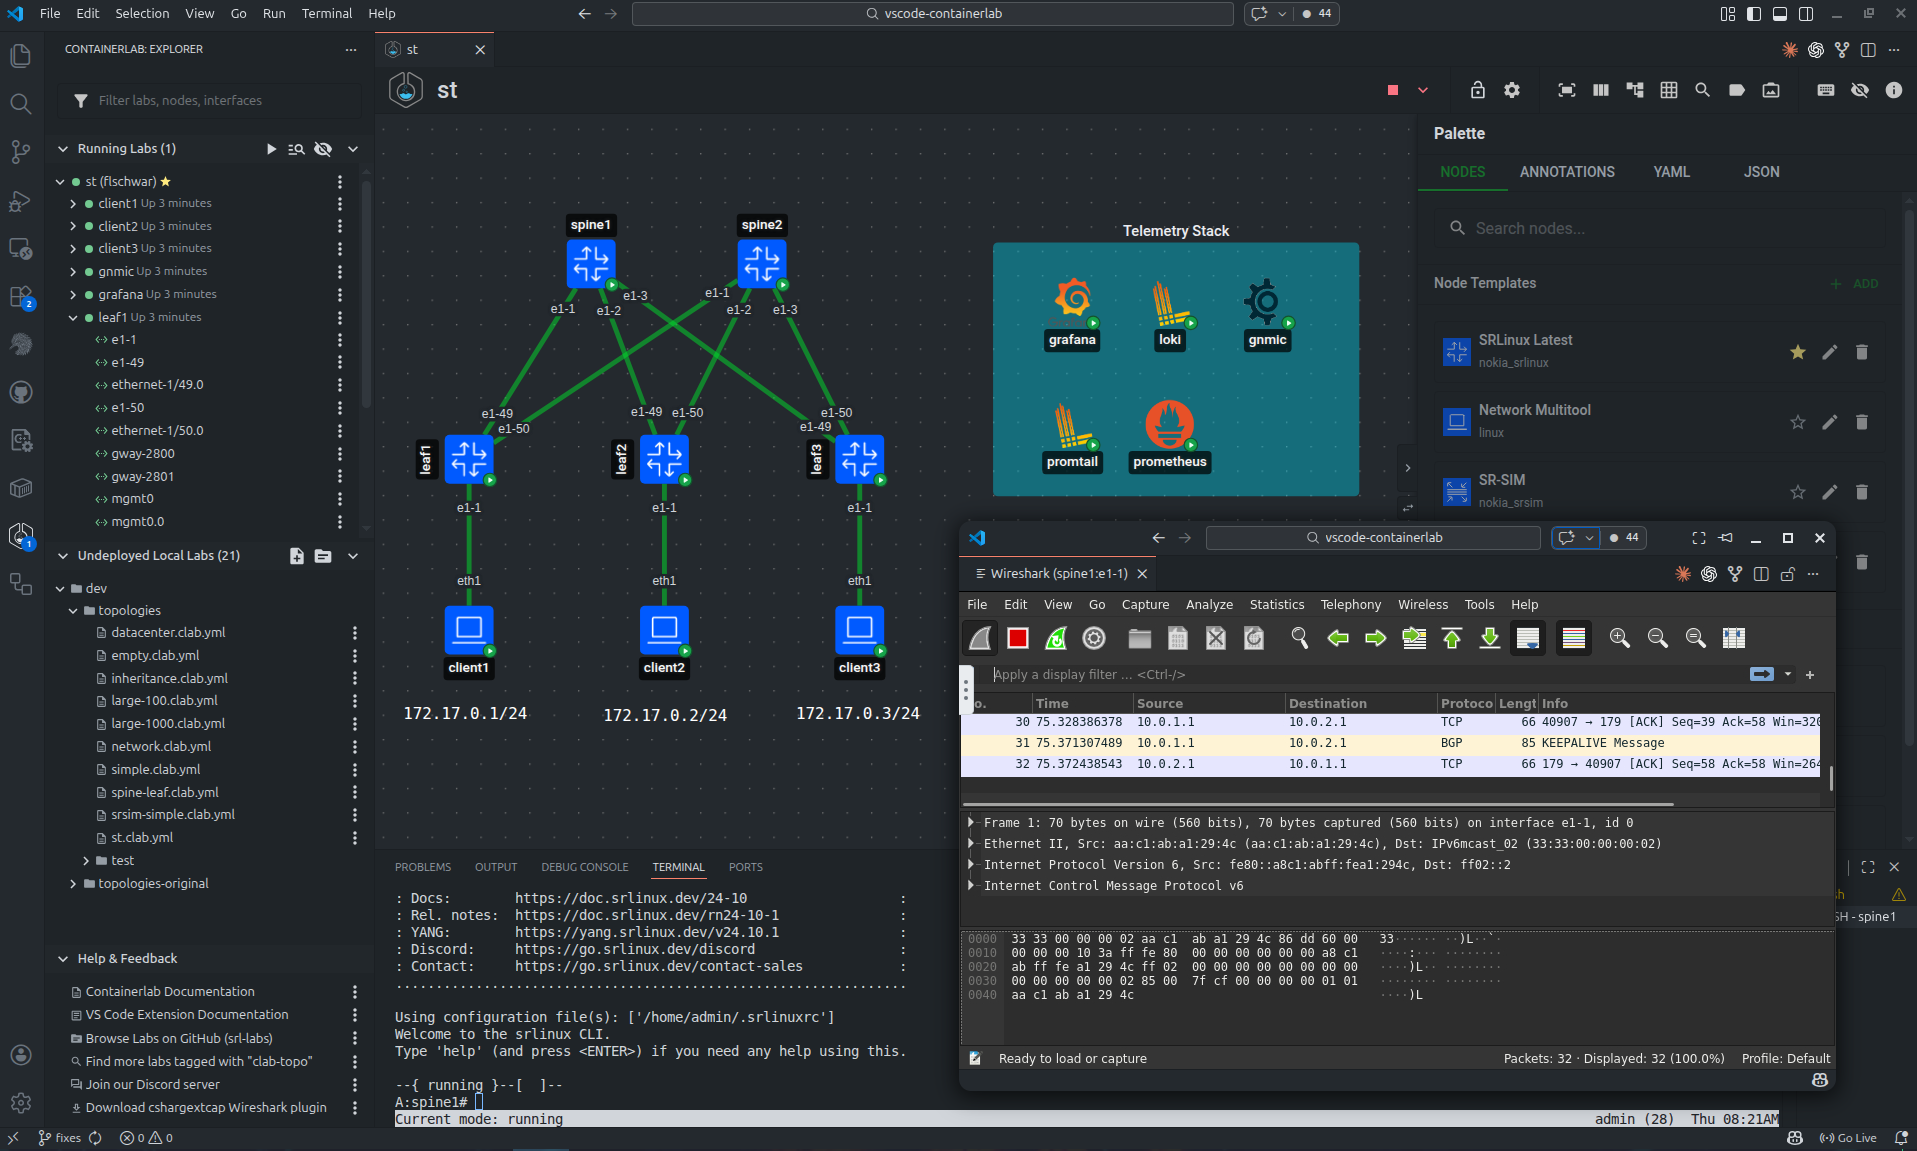
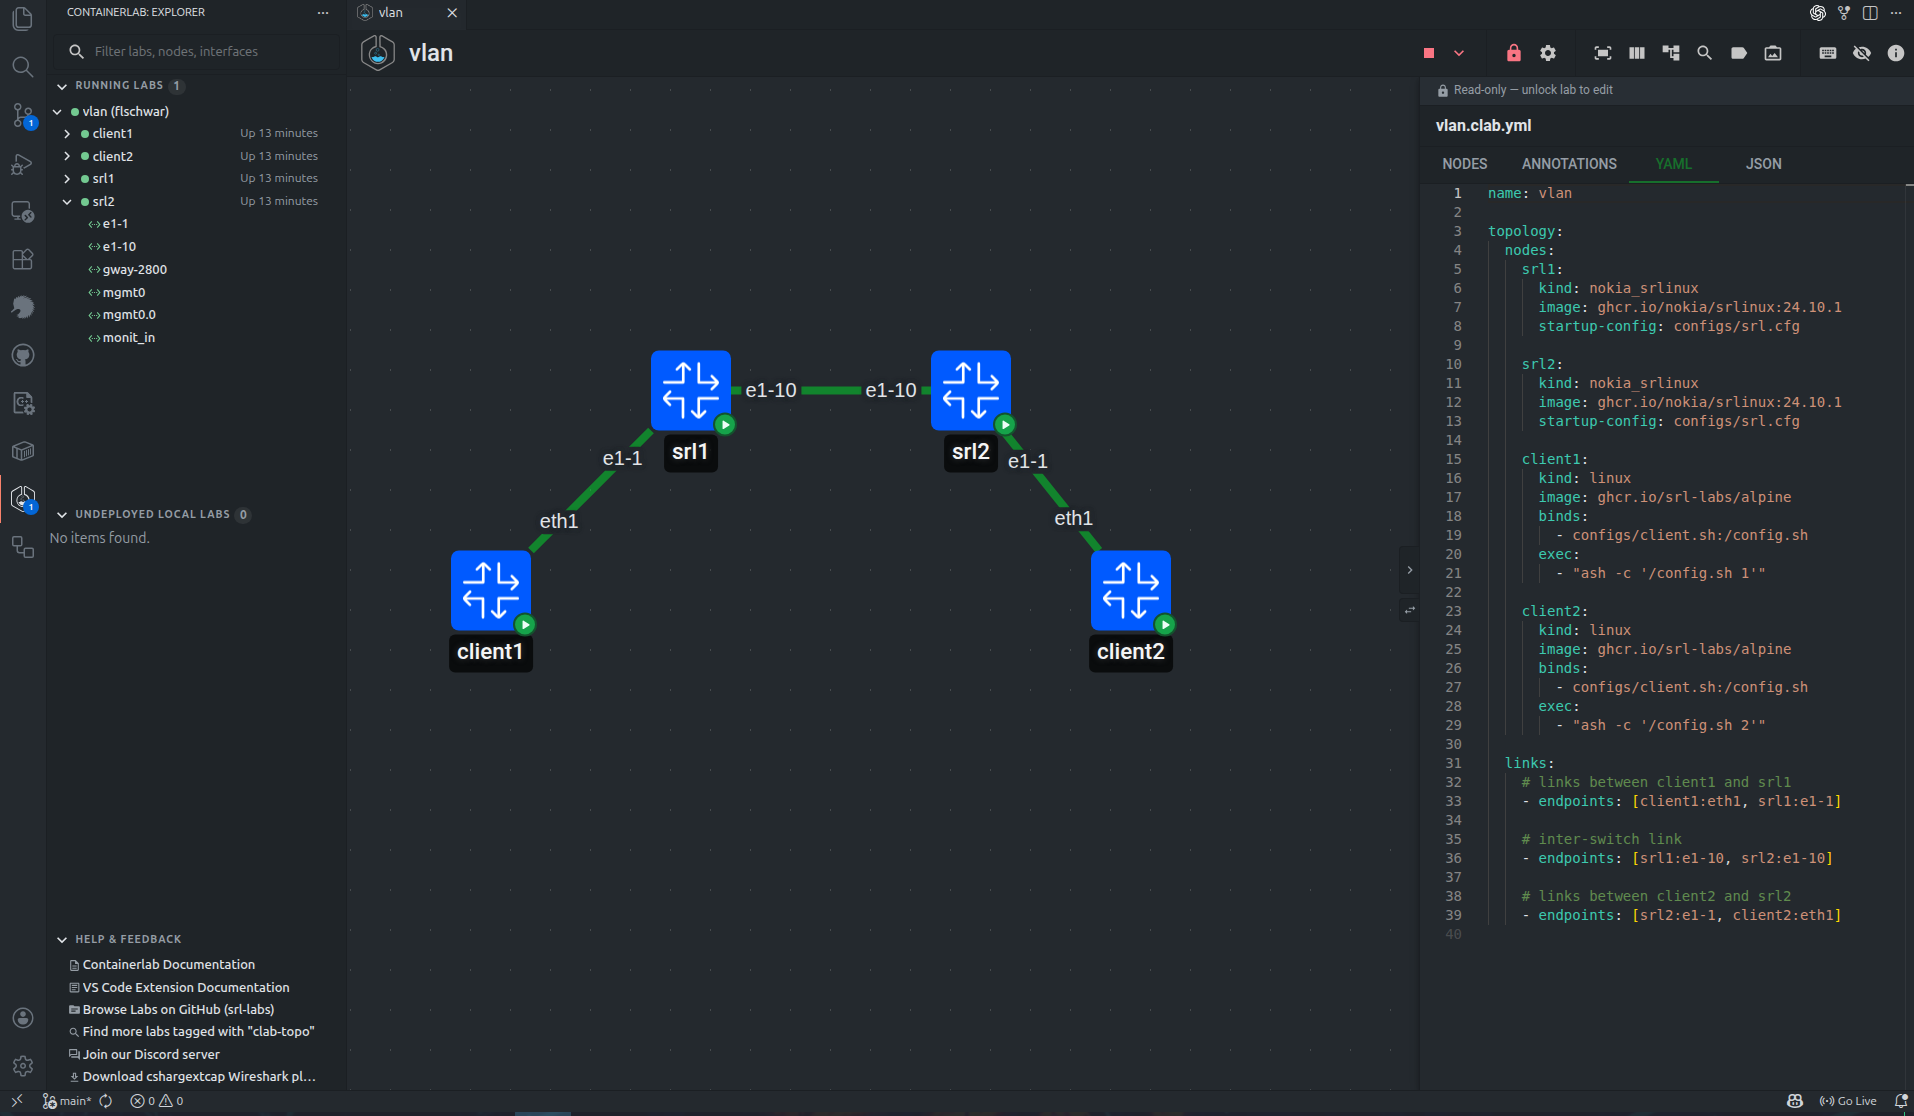
Explorer#
The Explorer shows running labs, known topology files, endpoints, and common actions.
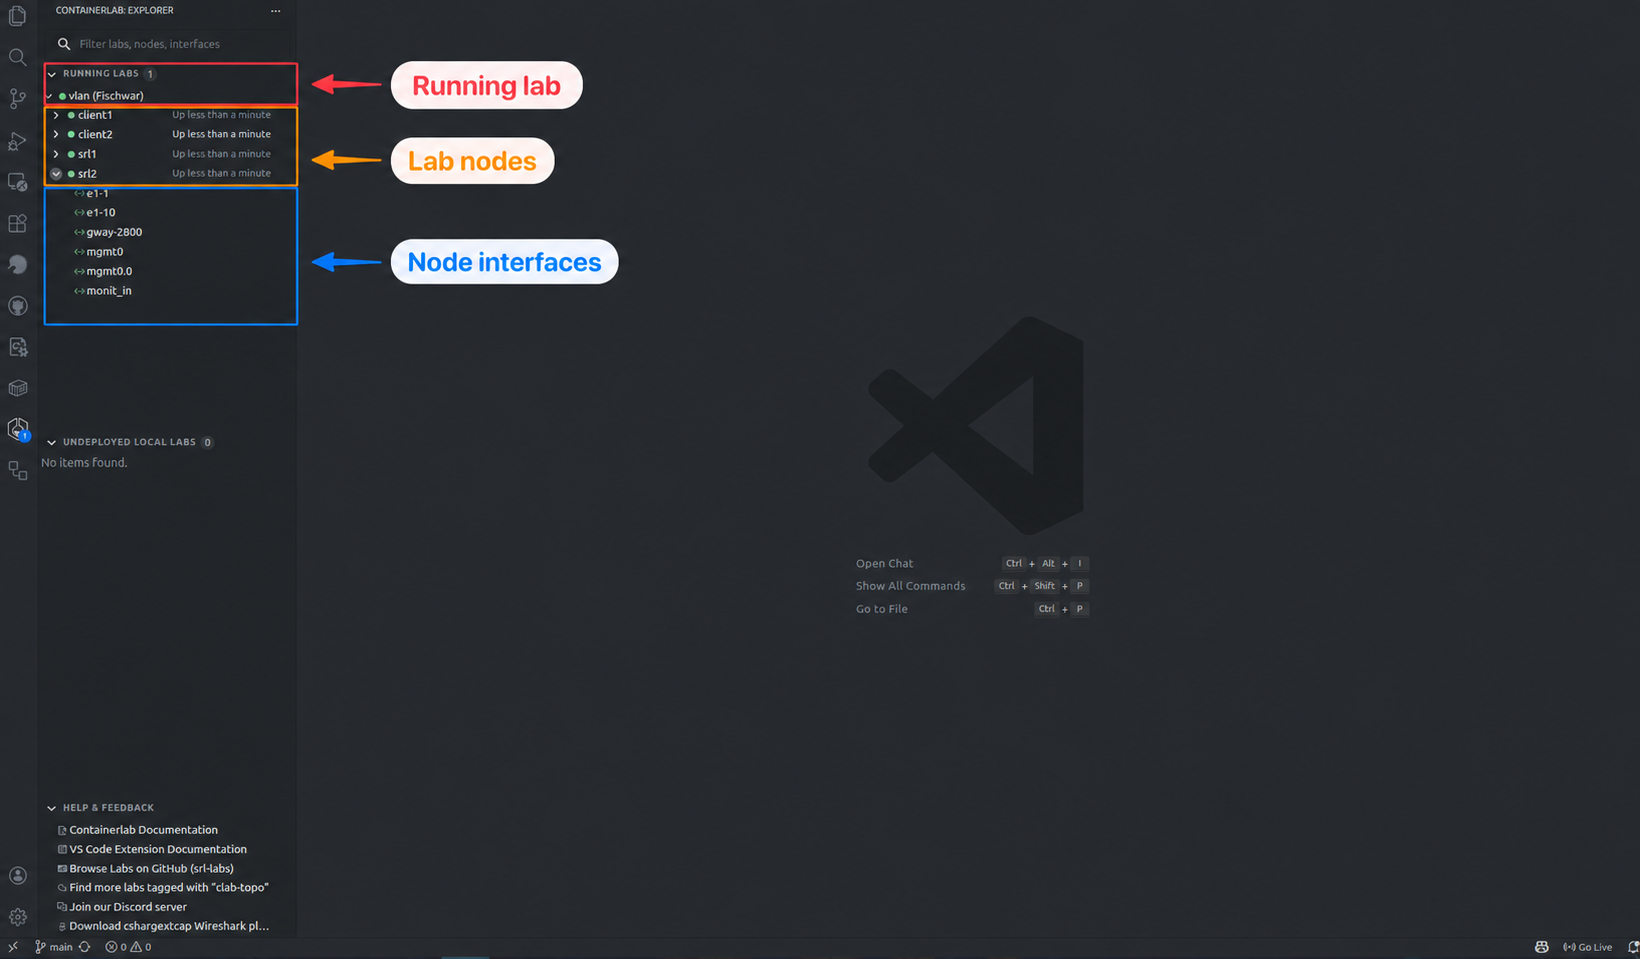
The Explorer can:
- search and filter labs, nodes, and interfaces
- show running, stopped, partial, and undeployed labs
- expand running labs down to nodes and interfaces
- expose lab, node, and interface actions
- show live interface statistics
- group labs by API endpoint in standalone apps
- hide labs owned by other users when the API server provides ownership metadata
VS Code discovers topology files from the open workspace and running labs from the Containerlab host. Desktop and Web discover files and running labs through the API server endpoints you sign in to. When multiple endpoints are connected, the Explorer groups labs and files by endpoint so one GUI can operate several lab hosts without mixing their state.
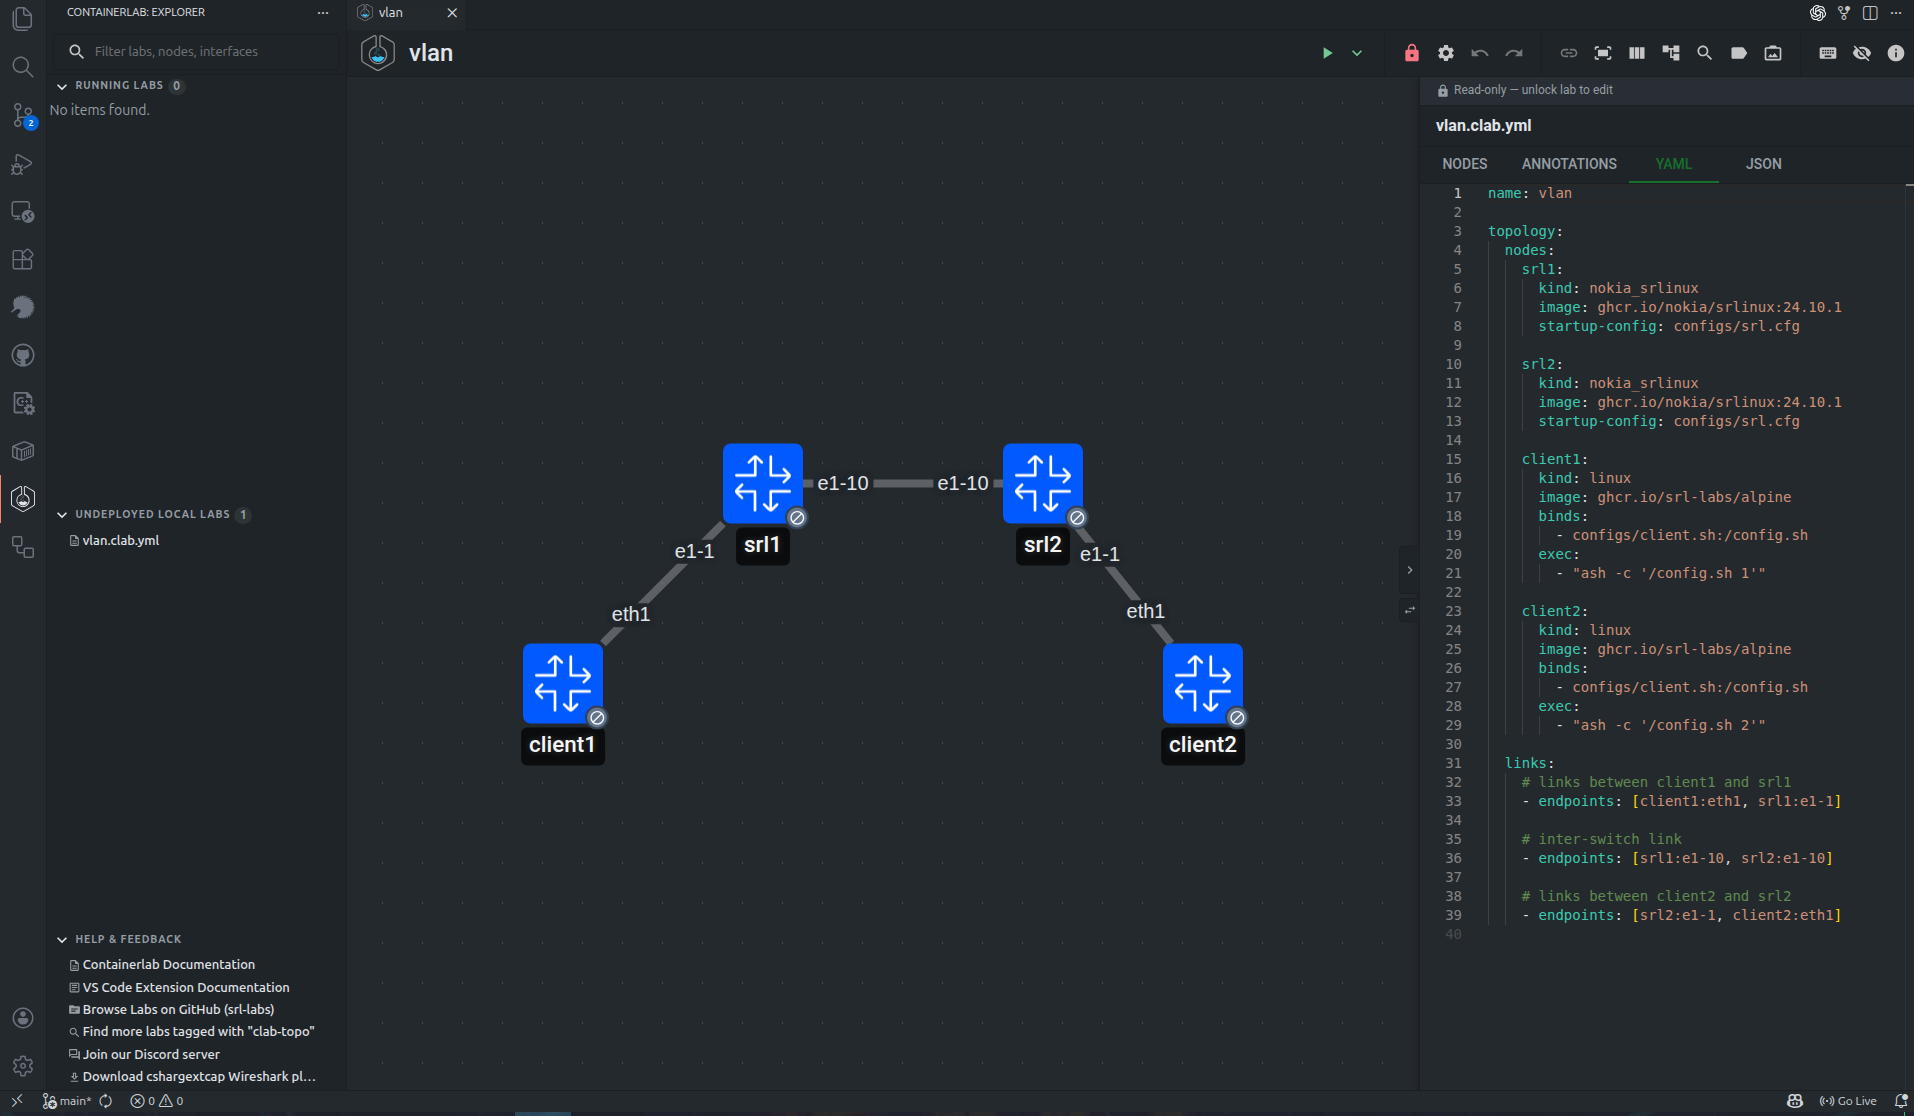
Topology editor#
TopoViewer is the shared canvas and source editor.
Use it to:
- add nodes from built-in or custom templates
- drag nodes, networks, and annotations from the palette to the canvas
- create links between nodes
- edit node, link, lab, and annotation properties
- move nodes and arrange the lab
- add free text, shapes, groups, and interface labels
- edit the topology YAML and annotations JSON, including in split view
- save topology changes back to files
When the lab is not running, TopoViewer opens in editor mode. Editor mode allows topology changes and writes them back to the topology file.
When the lab is running, TopoViewer opens in viewer mode. Viewer mode focuses on operational actions and avoids accidental topology changes while the deployed lab is active. You can unlock the canvas when you need to edit visual annotations.
The toolbar also includes Bulk Link Devices, Find Node, Fit to Viewport, Link Labels, and Toggle YAML Split View. Bulk linking is useful for leaf-spine and numbered topologies: match node names with patterns such as leaf*, spine*, srl?, or leaf(\d+) to spine$1, then confirm the generated links before they are added.
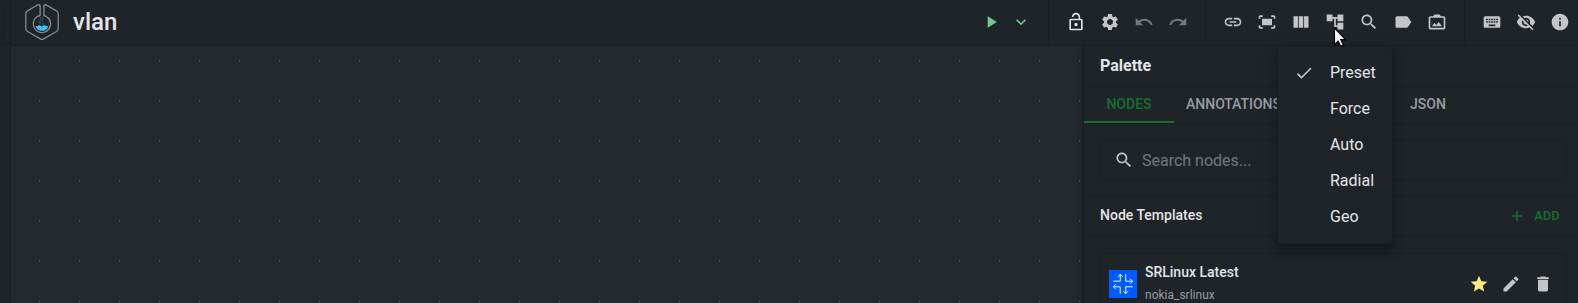
Layouts and appearance#
The layout menu changes how TopoViewer places nodes on the canvas.
| Layout | Use it for |
|---|---|
| Preset | Keep the positions already stored in the annotations file, or the positions you arranged manually. |
| Auto | Build a readable generated layout for most topologies. Tree-like parts are arranged hierarchically, while dense mesh-like parts are handled separately. |
| Force | Spread dense or irregular topologies with a force-directed layout. |
| Radial | Place hierarchical topologies around a central node. |
| Geo | Work with topology positions on a map when geographic coordinates are available. |
Generated layouts update the node positions saved in the annotations file. They arrange topology nodes and network nodes; text, shapes, groups, and traffic-rate annotations remain visual annotations that you position yourself.
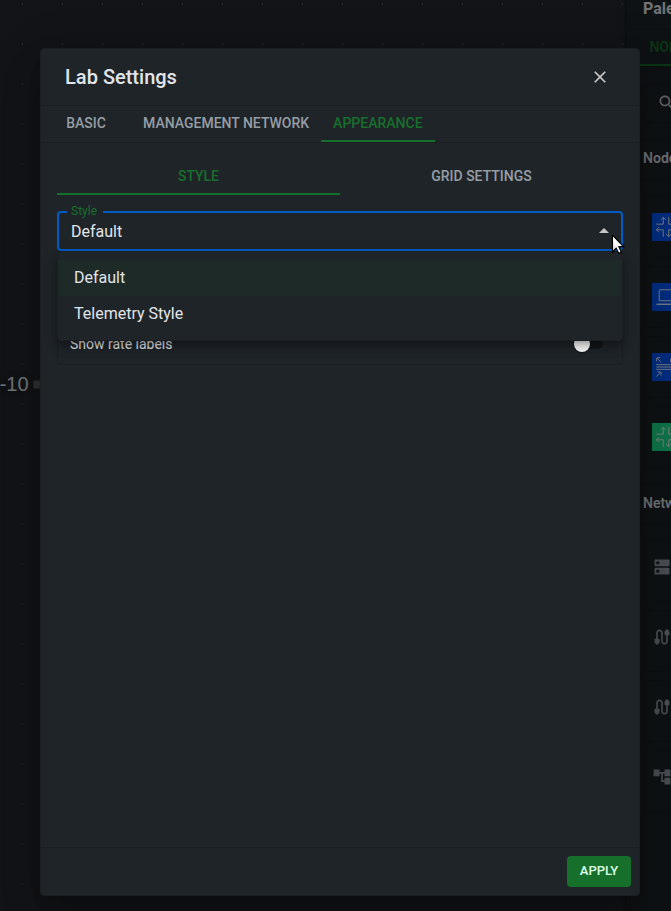
The Appearance tab in the lab settings controls how the canvas is presented. The default style keeps the normal editor view. Telemetry Style changes the topology into a dashboard-oriented view with configurable node size, interface bubble size, and compact interface labels.
Telemetry Style
Telemetry Style is only a display style. It does not deploy Grafana, Prometheus, or any telemetry collector by itself. Use it when you want the topology to look like a monitoring diagram, or when you plan to export a Grafana bundle.
The Appearance tab also controls:
- rate labels, which add traffic-rate annotation labels near link endpoints
- global and per-interface label shortening for long interface names
- grid style, grid color, and canvas background color
The Link Labels toolbar menu is separate from Telemetry Style. Use it to show all link labels, show them only when a link is selected, or hide them on the canvas.
Appearance preferences are saved with the topology annotations so the view can be shared with the lab files.
Node templates and drag-and-drop#
Node templates are reusable node presets shown in the Node Templates palette.
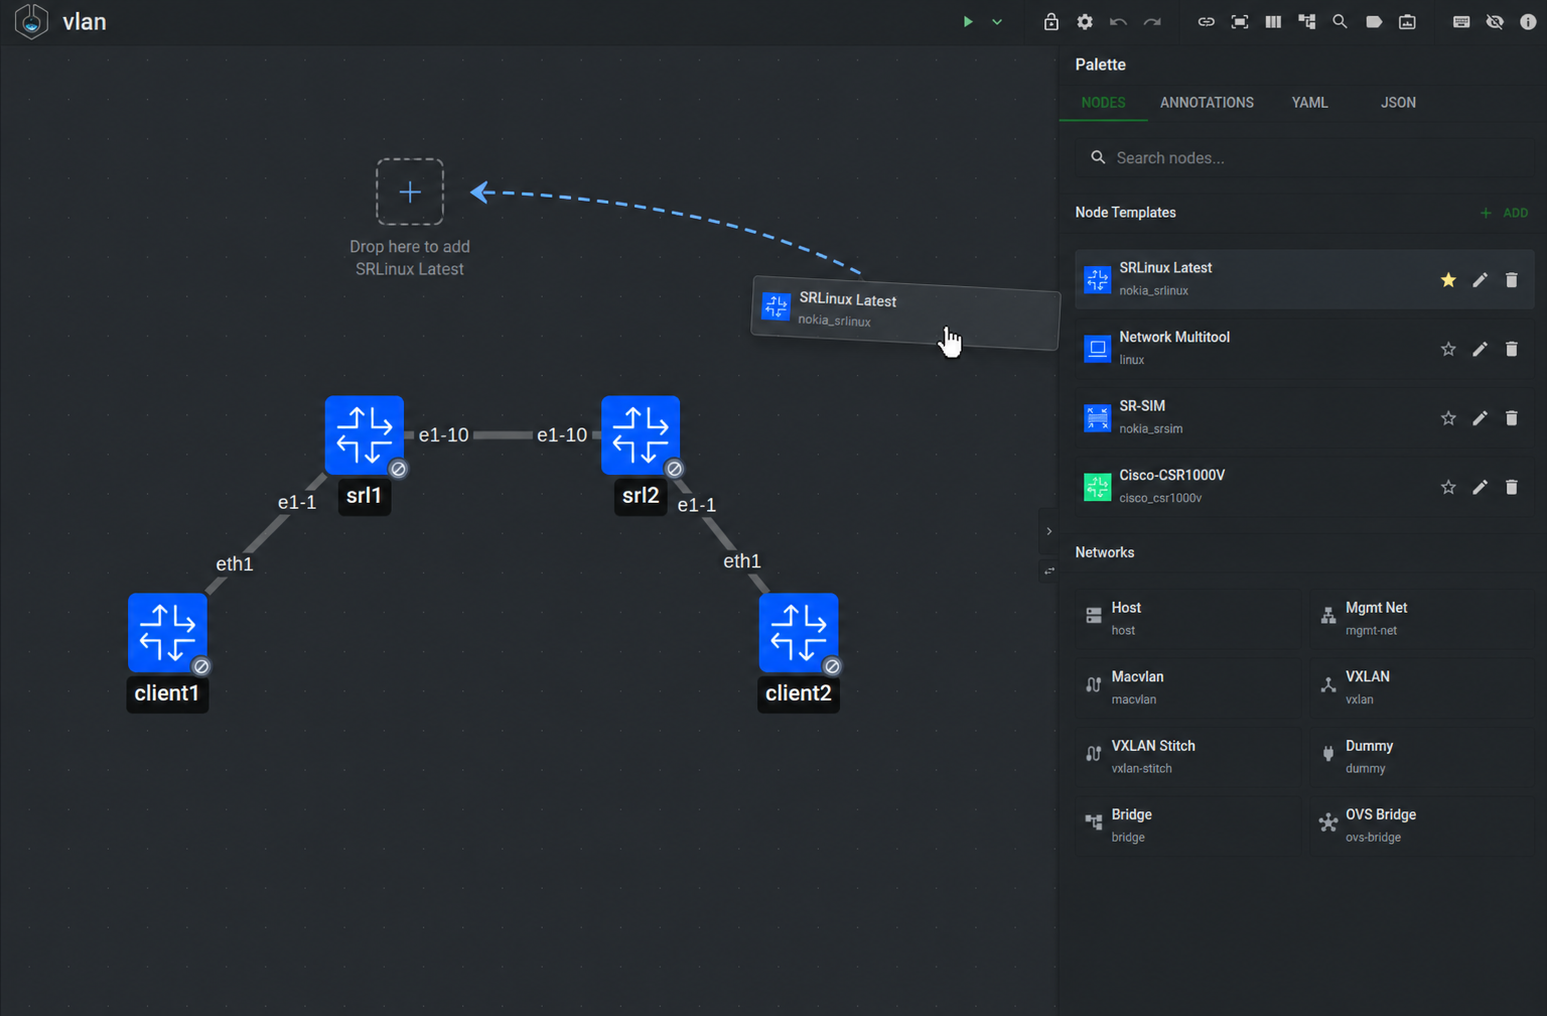
Drag a template from the palette onto the canvas to create a node at that position. You can also mark one template as the default template; quick-add actions such as adding a node from the canvas use that default when no explicit template is selected.
A node template can define common node fields such as:
kindtypeimage- icon and icon color
- startup config, binds, environment variables, licenses, and other node options
baseName, used to generate node names such assrl1,srl2, andsrl3
Use the template editor to create or edit node templates.
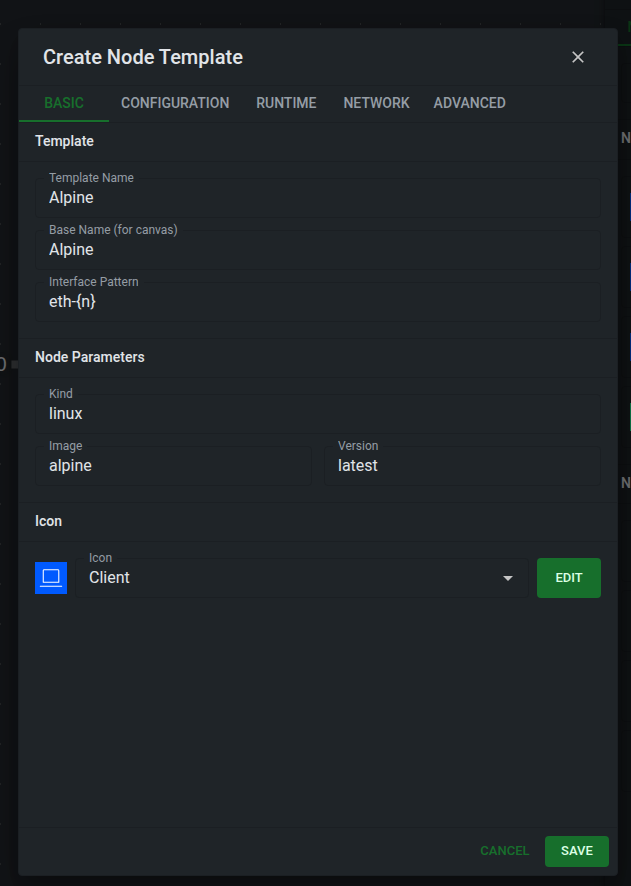
Interface pattern
interfacePattern tells the editor how to name interfaces when it creates links for a node. The pattern contains an {n} placeholder, and the editor replaces it with the next available interface number.
Use {n} for simple numbering. For example, e1-{n} creates e1-1, e1-2, e1-3, and eth{n} creates eth1, eth2, eth3.
Use {n:start} to choose the first number. For example, eth{n:0} starts with eth0, and Gi0/0/{n:2} starts with Gi0/0/2.
Use {n:start-end} to limit a range, and separate multiple patterns with commas when a node has split interface blocks. The editor fills the first range, then jumps to the next pattern. For example, 1/1/c{n:1-2}/1,1/1/c{n:5-6}/1 creates 1/1/c1/1, 1/1/c2/1, then jumps to 1/1/c5/1 and 1/1/c6/1.
Set this on custom node templates when the node kind uses interface names that the editor cannot infer from the kind alone.
Templates make the editor faster, but they do not introduce a new topology format. When you create a node from a template, the GUI writes a normal Containerlab node definition to the topology YAML.
The palette also contains networks and annotations. Drag networks onto the canvas to add management or bridge-style network objects. Drag annotations to add text, shapes, groups, and traffic-rate labels that are saved in the annotations file next to the topology.
Operating labs#
From the GUI you can deploy, redeploy, destroy, start, stop, restart, save, graph, and inspect labs where the host supports those actions.
Running nodes expose actions such as:
- open shell
- open SSH session
- show logs
- copy node details
- start, stop, or restart the node
- capture packets from an interface
- manage link impairments
In VS Code, shell and SSH actions open VS Code terminals. In Desktop and Web, terminal sessions are proxied through clab-api-server and shown in standalone terminal windows.
Image manager#
The GUI can manage local container images when the host exposes image operations.
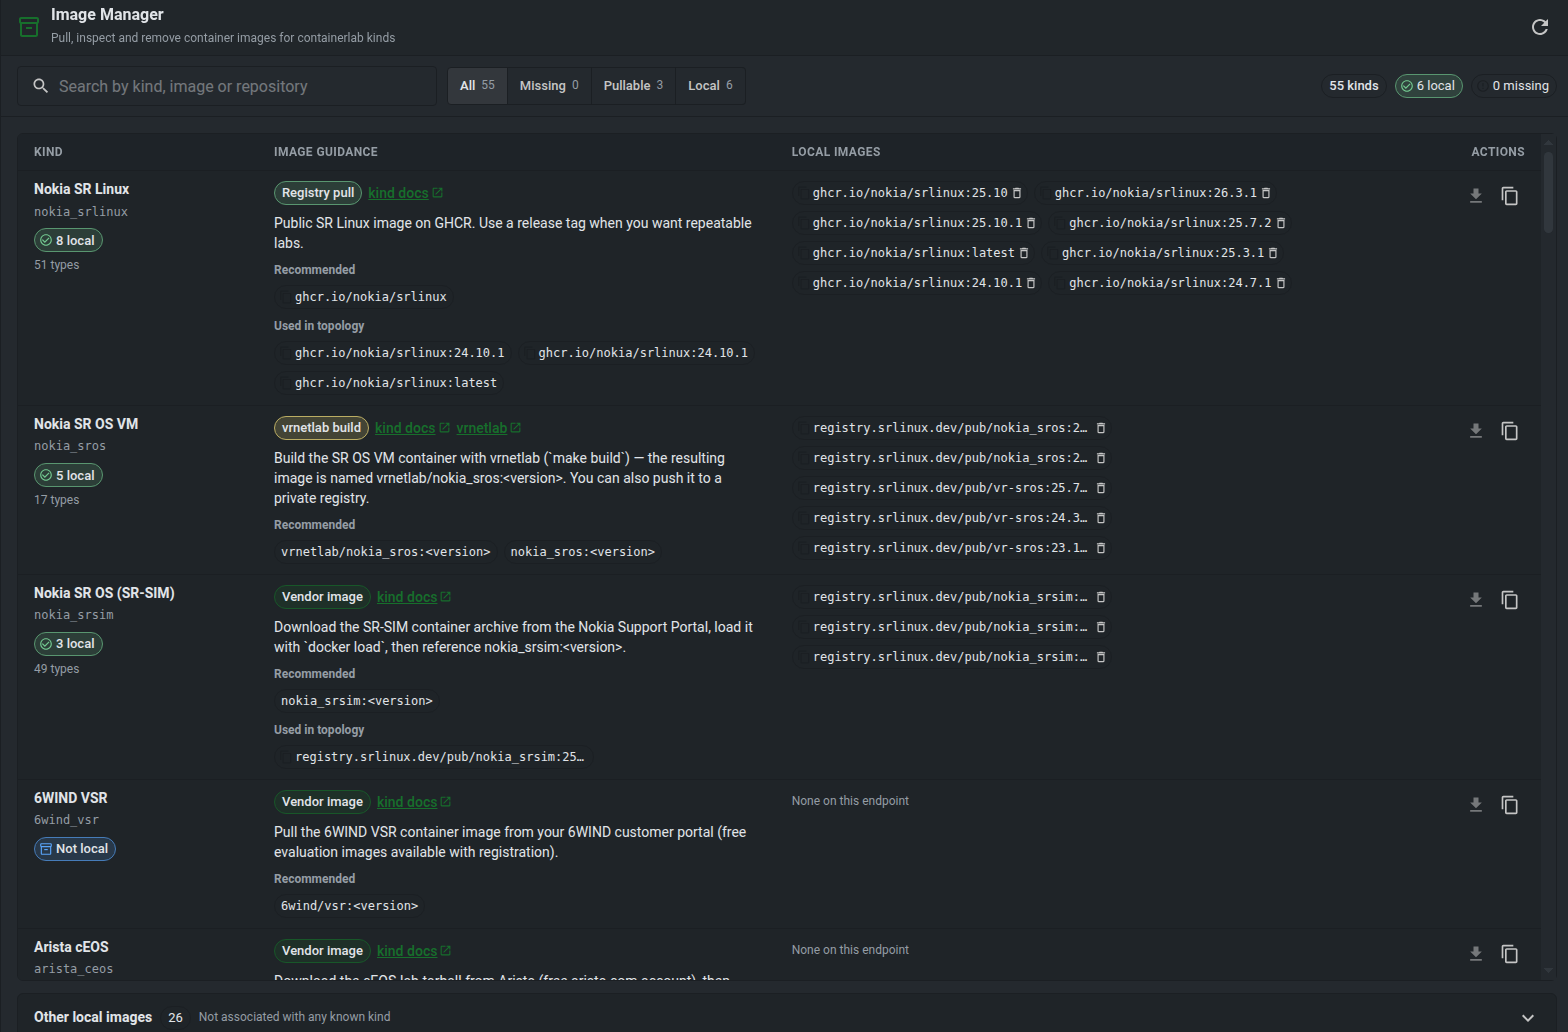
Use the image manager to see images referenced by labs and custom node templates, pull missing images, and remove images that are no longer needed.
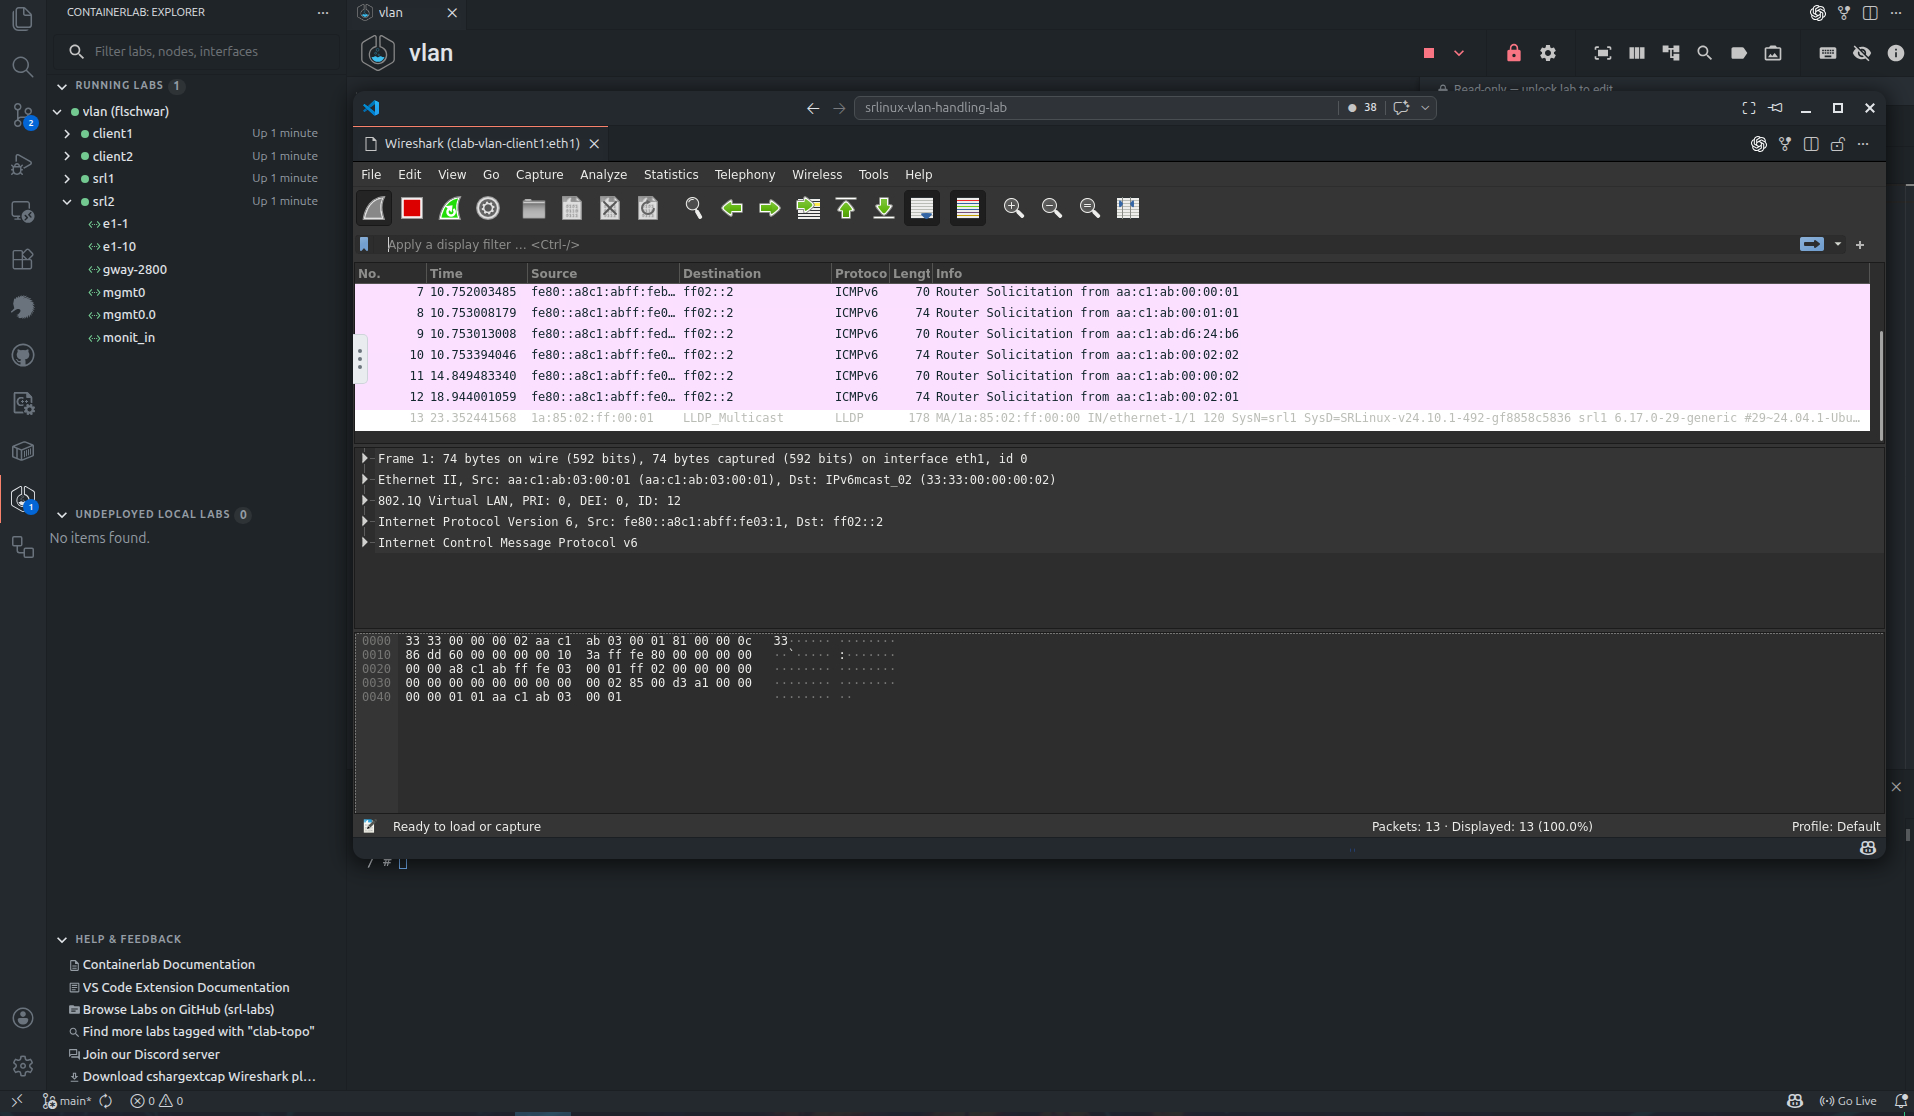
Packet capture#
Packet capture is available from interface actions when the host supports capture operations. The GUI uses Edgeshark/Packetflix capture URIs and Wireshark VNC sessions.
The launch path depends on the host:
| Host | Capture behavior |
|---|---|
| VS Code | The extension starts the capture flow from the VS Code host and opens Wireshark VNC in a VS Code webview. |
| Desktop and Web | The app calls API server capture endpoints and opens Wireshark VNC in a desktop or browser window. |
For packet capture to work, the Containerlab host must be able to run the required capture containers and expose the capture stream to the GUI host.
Draw.io diagrams#
Graph actions can generate Draw.io diagrams for a topology or running lab.
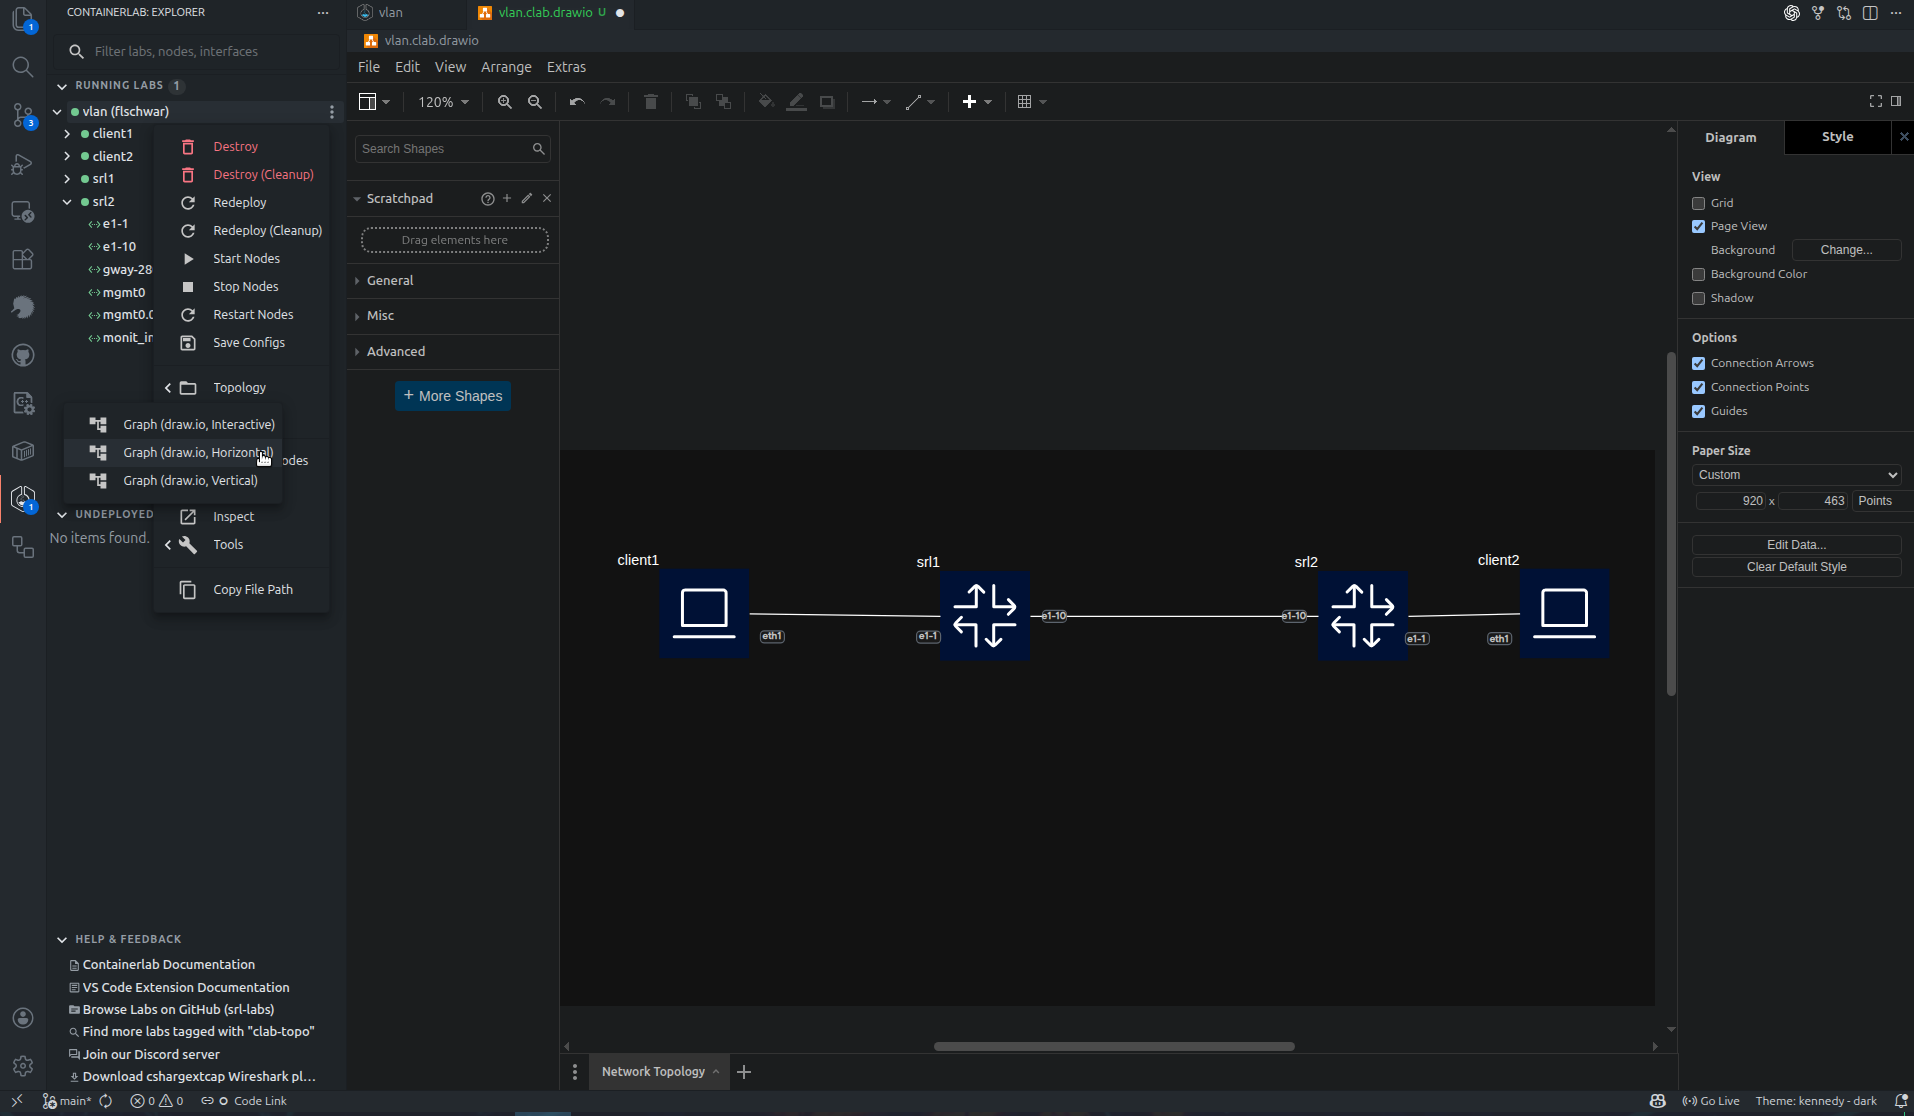
Horizontal and vertical Draw.io layouts are available across the GUI hosts. Interactive Draw.io mode is VS Code-specific; standalone apps generate the diagram file and report the result.
Draw.io export is useful for quick documentation diagrams. Use the SVG export when you want an exact capture of the current TopoViewer canvas, including appearance settings and annotations.
SVG and Grafana export#
Use Capture Viewport as SVG to export the visible TopoViewer canvas.
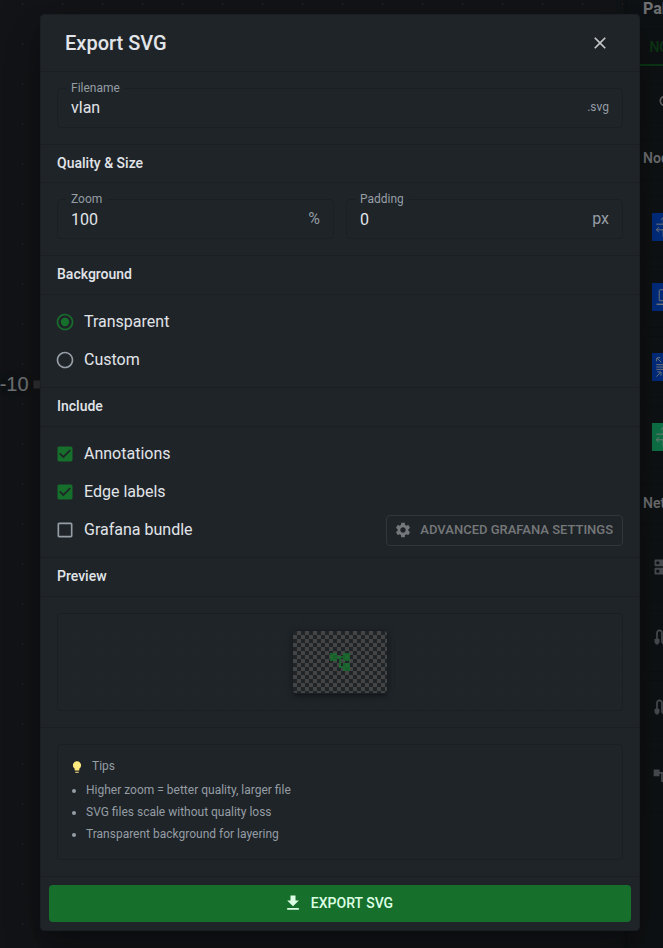
The SVG export dialog lets you choose the filename, zoom, padding, background, annotations, and edge labels. A plain SVG export creates one .svg file that can be used in documentation, diagrams, or external tools.
Enable Grafana bundle when you want to use the topology as a Grafana Flow Panel. The export creates:
| File | Purpose |
|---|---|
<name>.svg |
The topology SVG with Grafana cell IDs. |
<name>.grafana.json |
A Grafana dashboard JSON containing the Flow Panel. |
<name>.flow_panel.yaml |
Flow Panel mapping and threshold configuration. |
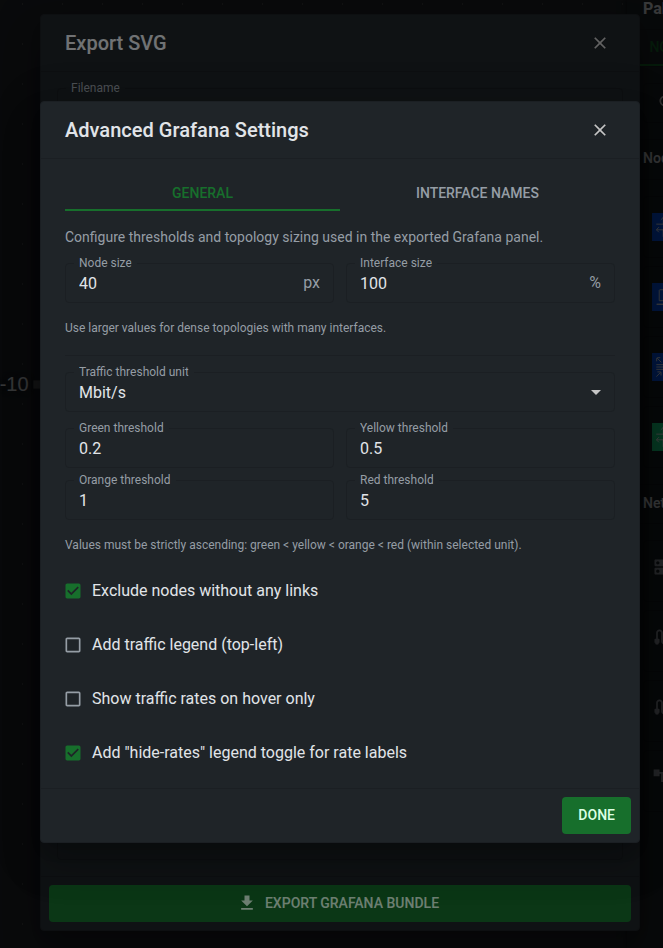
The Grafana bundle maps link traffic, interface endpoint state, and optional traffic-rate labels to Grafana cells. Advanced settings let you tune node and interface size, traffic thresholds, interface label shortening, whether unlinked nodes are excluded, whether a traffic legend is added, and whether rate labels are only shown on hover.
Telemetry data
The bundle does not deploy or configure a telemetry stack. It provides the visual panel files for a Grafana setup that already has matching telemetry data.
In VS Code, the extension asks where to save the exported files. In Desktop and Web, the files are downloaded by the browser or desktop webview.
Inspect and impairments#
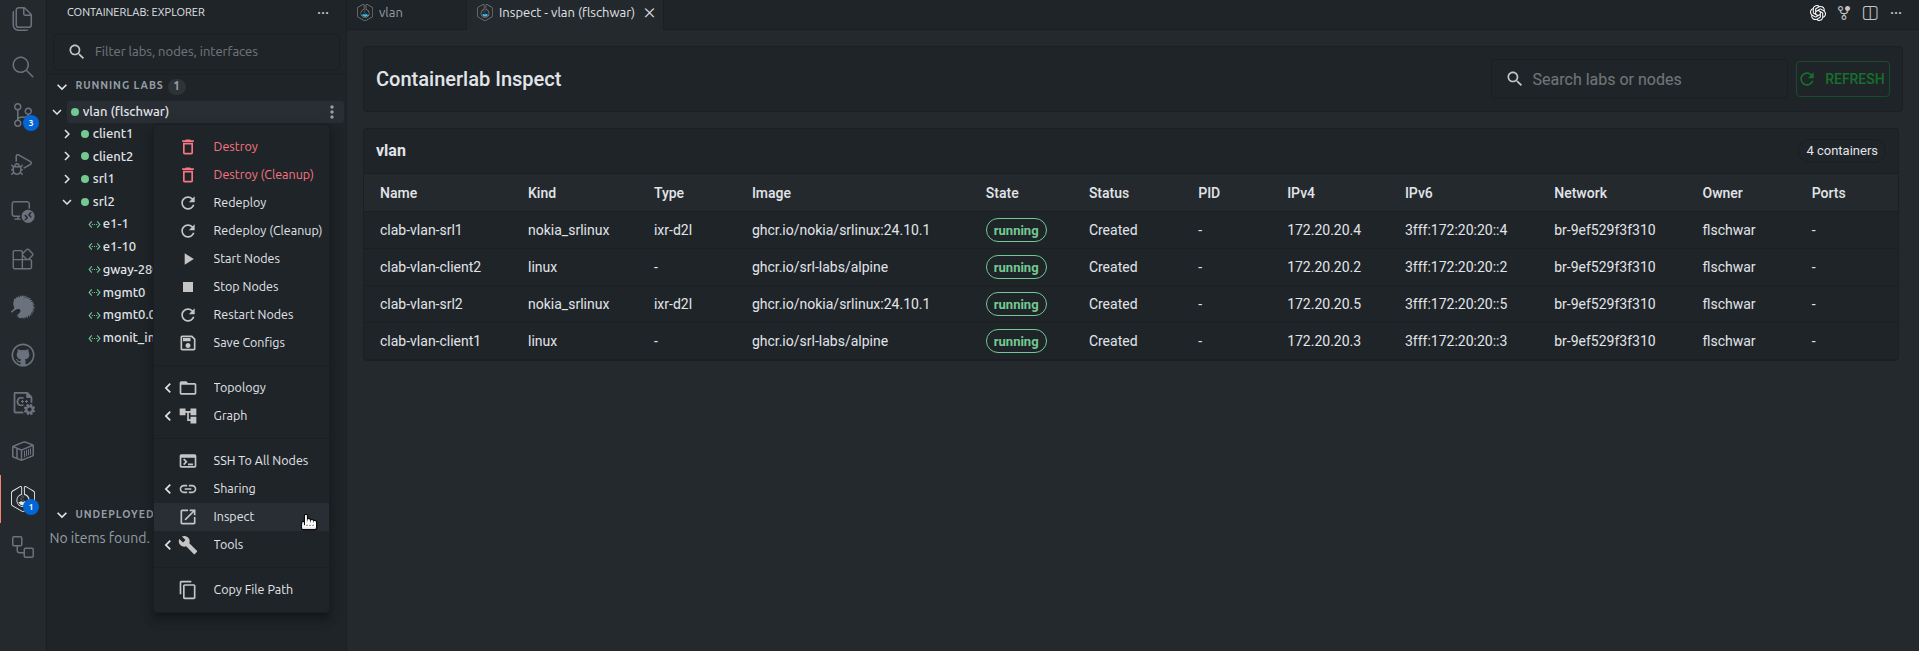
The inspect view shows running lab details in a table similar to containerlab inspect.
The GUI can also manage link impairments where supported by the host platform. Link impairments include delay, jitter, packet loss, rate limiting, and corruption.
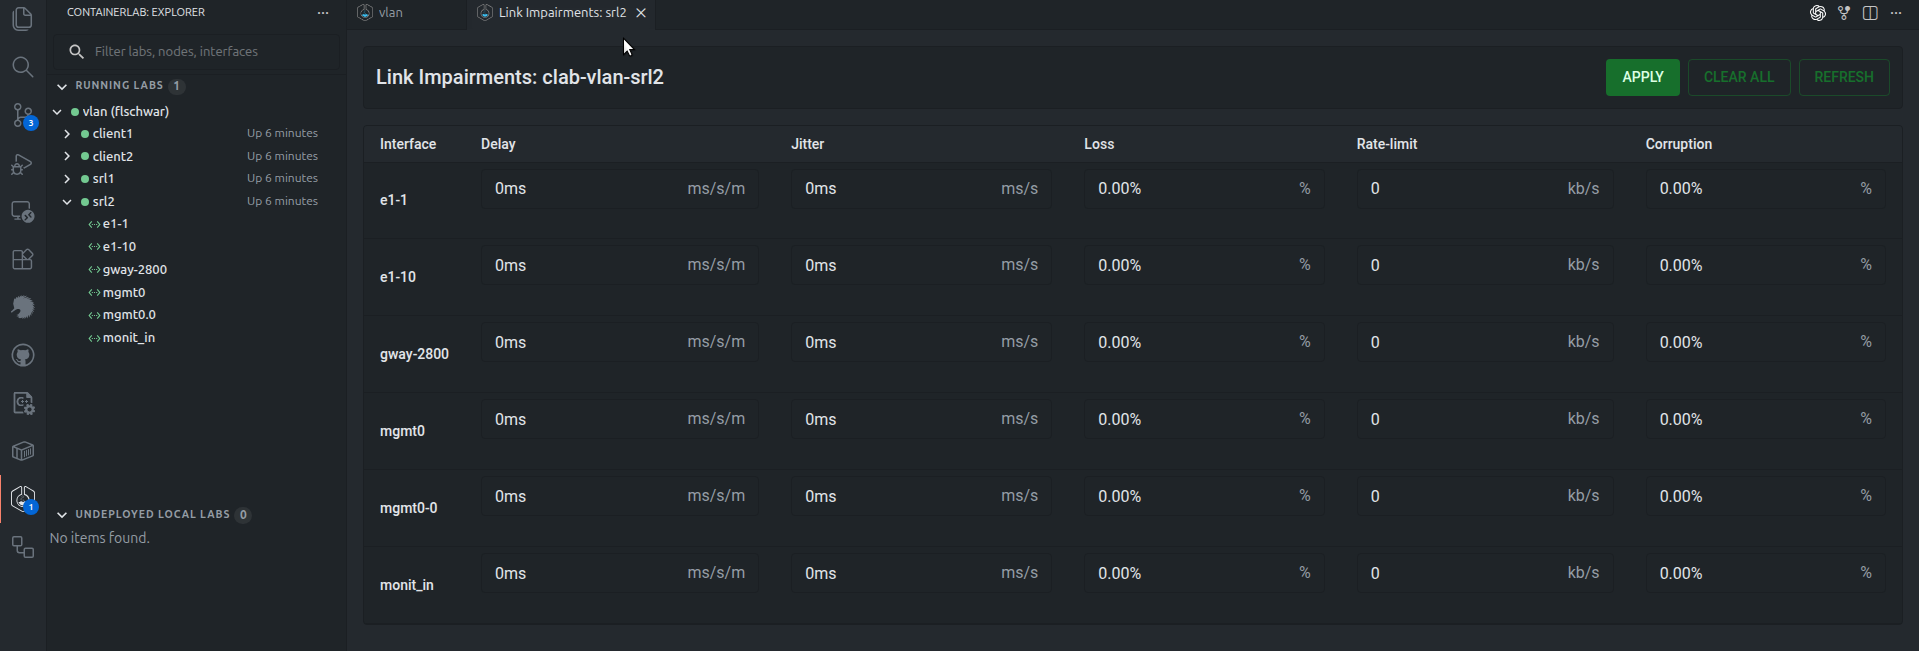
Platform support
Link impairments require Linux networking support on the Containerlab host.
Host support#
| Capability | VS Code Extension | Desktop and Web |
|---|---|---|
| Lab runtime owner | VS Code host | clab-api-server host |
| Authentication | Local VS Code user/session | Linux/PAM user accepted by API server |
| Topology file access | VS Code workspace and host filesystem | API server file APIs |
| Running lab updates | Containerlab events or polling | API server event streams |
| Node terminals | VS Code terminals | Browser/desktop terminal windows |
| Packet capture | Extension commands and VS Code webviews | API server capture endpoints |
| Custom node templates | VS Code settings | Per Linux user on the selected API server endpoint |
| Layouts and appearance | Shared TopoViewer behavior | Shared TopoViewer behavior |
| SVG export | Save through VS Code | Download through browser or desktop webview |
| Grafana bundle export | Save .svg, .grafana.json, and .flow_panel.yaml through VS Code |
Download .svg, .grafana.json, and .flow_panel.yaml |
| Best remote workflow | VS Code Remote SSH | Reachable API server endpoint |
Keyboard shortcuts#
TopoViewer handles common canvas shortcuts when focus is on the canvas rather than an input field.
| Action | Shortcut |
|---|---|
| Select node/link | Left Button |
| Draw selection box | Shift + drag |
| Open node/link actions | Right Button |
| Action | Shortcut |
|---|---|
| Add node | Shift + click empty canvas |
| Create link | Shift + click source node, then click target node |
| Draw selection box | Shift + drag |
| Context menu | Right Button |
| Select all | Ctrl+A / Cmd+A |
| Copy | Ctrl+C / Cmd+C |
| Paste | Ctrl+V / Cmd+V |
| Duplicate | Ctrl+D / Cmd+D |
| Undo | Ctrl+Z / Cmd+Z |
| Redo | Ctrl+Y / Cmd+Y or Ctrl+Shift+Z / Cmd+Shift+Z |
| Create group | Ctrl+G / Cmd+G |
| Delete selection | Del / Backspace |
| Delete node | Alt + click node |
Try the sandbox#
The browser sandbox is useful for trying the editor, drafting *.clab.yml files, and visualizing topologies without installing anything.
The sandbox stores files in browser storage and does not connect to a real Containerlab host. To deploy, destroy, inspect, capture packets, or open terminals, use the VS Code extension, Desktop app, or Web app with a real Containerlab host.